The personnel department keeps records on all employees in a company. Here is the information that they keep in one of their data files: employee identification number, last name, first name, middle initial, department, number of years with the company, salary, education (coded as high school, some college, or college degree), and age.
Identify the WHO and the WHAT in this scenario.
For the WHAT, do remember to indicate the type (categorical or quantitative) and units/categories of the variable.
[Optional parts or comments in brackets.]
Who: The employees of this company. [Or: the records of the employees of this company]
What:
Suppose that 30 voters are randomly sampled and we record several things about them:
For each of the variables, which graph would you use to display them and why?
The graph type is based on the variable type:
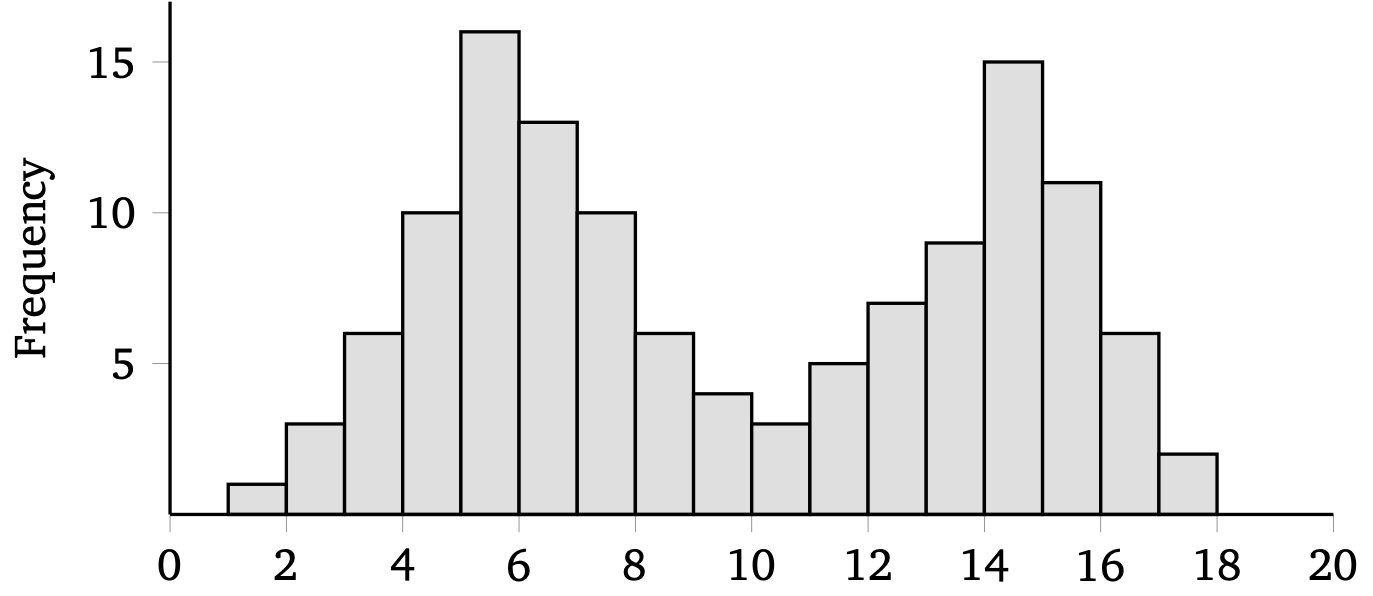
Briefly describe the shape (symmetry, modality, and outliers) of this distribution.
Then, to describe the centre and spread of a distribution, you have some choice:
Which of these two is most appropriate for the distribution above, and why?
This distribution is [approximately] symmetric, bimodal, no outliers.
The mean and standard deviation is appropriate, because the distribution is symmetric.
Which boxplot has the least spread? How did you determine that?
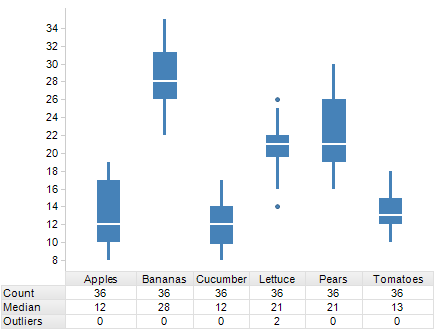
Lettuce because its IQR (width of box) is smallest. (We usually use the IQR when the median is shown.)
[Also OK: Tomatoes since the range is smaller. The range is not often used, but it is still a valid measure of spread.]
Describe this scatterplot in terms of direction, form, strength and outliers.
Positive, linear, strong relationship with no outliers.
[One may say that one or two of the upper-right could be outliers.]
How well does the population of a state predict the number of undergraduates?
The population and the number of undergraduates in each state are measured.
The least squared regression line is \(\widehat{y} = -15057 + 0.05326x\).
Interpret the regression slope and intercept in full context of the problem.
Intercept: The predicted number of undergraduates in a state with population 0 is \(-15057\) students.
Slope: When the population of a state increases by 1 person, the predicted number of undergraduates increases by 0.05326 students.
Suppose that 15 random adults are asked their age and number of cats they've had in their life.
The fitted line plot and regression output are produced:
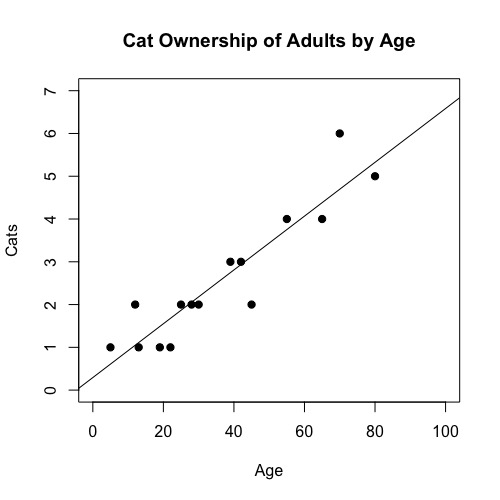
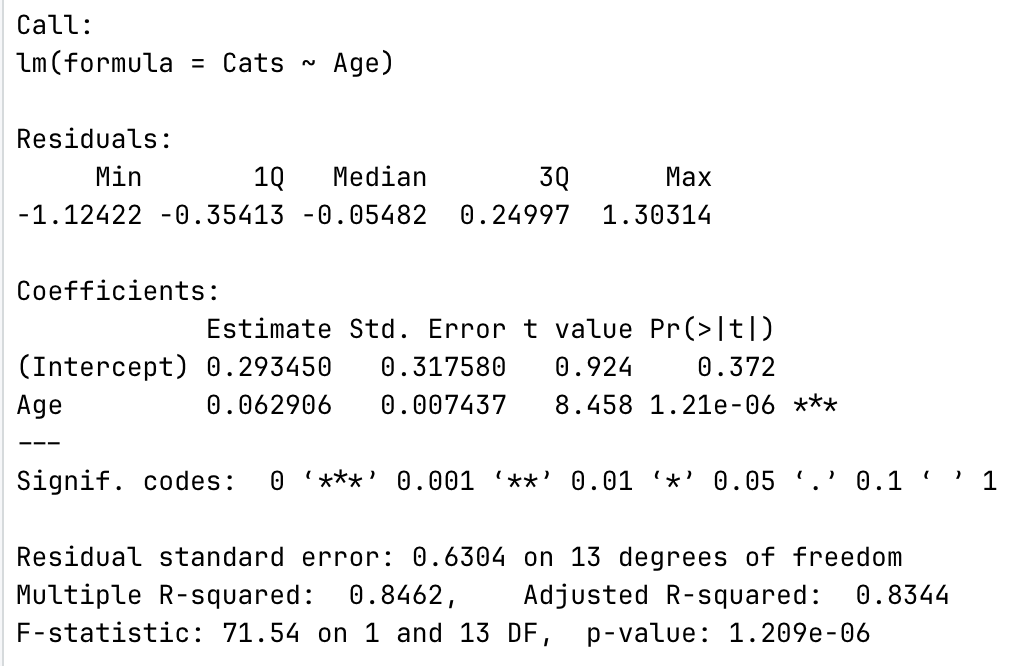
Are the assumptions for regression met?
Interpret the slope and intercept of the regression model in context.
We see that \(r^2 = 84.62\%\). Interpret this in full context.
Quantitative Variables Condition: The number of cats owned and age (years) are both quantitative. Good!
Straight Enough Condition: The scatter plot has no apparent bends and looks straight. Good!
No Outliers Condition: We don't see any observations with high/low x-values or high residual. Good!
The intercept: The predicted number of cats for a 0-year-old adult [which, of course, makes no physical sense] is 0.29 cats.
The slope: For each 1-year increase in age of adults, the predicted number of cats they've owned increases by 0.06 cats.
r-squared (84.62%): 84.62% of the variation observed in the number cats owned in this sample can be explained by the linear regression on age.